“`html
How to Effectively Find Domain and Range of a Graph
Understanding how to find the domain and range of a graph is crucial for anyone studying mathematics, particularly in 2025 when advancements in technology and teaching methods make this skill even more accessible. Understanding these concepts helps with various fields, including engineering, physics, and economics. In this article, we will explore methods for finding the domain (the set of possible x-values) and the range (the set of possible y-values) of various types of graphs through a visual approach, tools, and practical examples.
Understanding the Domain of a Graph
The domain of a graph comprises all the possible input values (x-values) that you can plug into a function to obtain real and valid outputs (y-values). Whether the function is a simple line or a more complex polynomial function, knowing the domain allows you to understand the function better. To find the domain, consider the following factors:
Identifying Restrictions
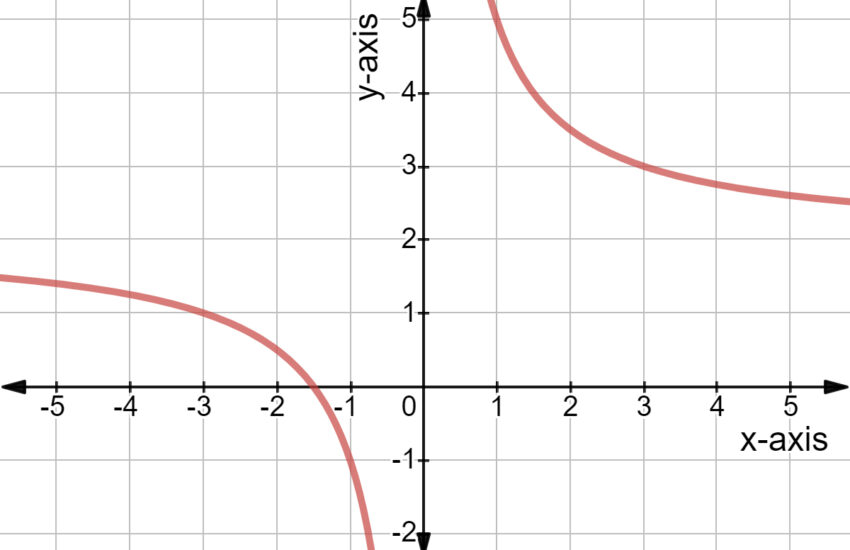
First, it’s important to identify any restrictions on the function. For instance, if you have a rational function, you need to ensure the denominator does not equate to zero. This leads to identifying values that could lead to undefined behavior. You can often visualize these points as vertical asymptotes in your graph. Additionally, for functions involving square roots, the expression inside the square root must be greater than or equal to zero.
Analyzing Intervals in the Graph
Next, examining the endpoints of intervals can give you insights into the domain. Are there any closed or open intervals to consider? A closed interval suggests that endpoints are included in the domain, whereas an open interval hints that they are excluded. For example, if a graph plots a step function starting at (1,0) and continues indefinitely to the right, the domain might be represented in interval notation as [1, ∞).
Utilizing Graphical Methods to Determine Domain
Using the vertical lines test can help visually determine the domain and ascertain behaviors at critical points. This method involves checking whether vertical lines intersect the graph at multiple points to confirm it is indeed a function. Furthermore, tools like graphing software can simplify this process by accurately plotting functions and allowing for close examination of their behavior across intervals.
Exploring the Range of a Graph
After addressing the domain, the next critical step is determining the range of a graph. The range refers to all possible output values (y-values) a function can generate based on the domain. Identifying the range can sometimes be more challenging than finding the domain, especially in complex graphs.
Identifying the Output Limits
Start by locating the highest and lowest points on the graph. Functions that exhibit bounds will have a clear maximum and minimum. On the other hand, for unbounded functions, the y-values may extend infinitely either upwards or downwards. This distinction can be effectively illustrated by sketching the graph and noting the highest or lowest y-values on the graph, thus outlining the range clearly.
Employing Notation for Range Representation
Representing the range using set notation or interval notation is crucial. For instance, if your output values range from 0 to 5, the range can be expressed in interval notation as [0, 5]. This makes it immediately clear what values are included. Specific transformations, such as vertical shifts, can alter these ranges, hence affecting the values accordingly.
Practical Examples and Case Studies
Consider the graphical representation of a quadratic function, such as y = x². The lowest point of this curve is at (0,0), making the range [0, ∞). Conversely, if you were working with y = √(x – 2), the graph starts at the point (2, 0) and extends infinitely upwards, showing that the range is also [0,∞). This practical example illustrates the methods discussed and highlights how examining graphs assists in identifying ranges.
Graphing Techniques and Tools for Domain and Range
In modern mathematics, numerous tools and graphing techniques can simplify the process of finding both the domain and range of various graphs. The emergence of sophisticated graphing calculators and software plays a crucial role in today’s learning.
Interpretation of Graphing Software
Graphing software often lets users visualize complex functions with ease. You can input a function, and the tool plots it automatically, showing critical points. Various possibilities for transformations can be executed conveniently, which offers deep insights into how alterations affect the corresponding domains and ranges of functions.
Important Properties to Consider
When using graphical methods, understanding the properties of functions is critical. For example, bounded functions will typically have both maximum and minimum output. It’s essential also to be conscious of potential intersections in multiple function outputs when analyzing ranges, which may lead to interpreting their sets collectively.
Connecting Domain and Range to Real-World Applications
Beyond just theoretical applications, understanding domain and range is vital in real-world applications. For instance, in financial modeling, the demand for a product over time may relate directly to being aware of constraints in pricing, making domain analysis essential.
Key Takeaways
- Understanding how to find the domain and range of a graph is essential for studying any type of mathematical function.
- Identifying restrictions, analyzing intervals, and utilizing visual methods are effective techniques.
- Graphing software and tools have enhanced the learning experience, making domain and range analysis more approachable.
- Real-world applications demonstrate the importance of these concepts in various fields.
FAQ
1. What are the common mistakes when finding domain and range?
Common mistakes include overlooking vertical asymptotes and boundaries of functions, especially in rational and radical functions. Double-checking inputs for potential exclusions due to square roots or division by zero is advisable.
2. How does transformations affect domain and range?
Transformations like vertical and horizontal shifts alter the location of the function’s graph. A vertical shift upwards increases the minimum y-value (affecting the range), while horizontal shifts may displace the intervals of the domain.
3. Are there differences in finding domain and range for different types of functions?
Yes, continuous functions like polynomials typically have no restrictions, whereas rational and piecewise functions may require careful consideration of several intervals and limitations. Continuous vs. discrete characteristics also markedly differ in their domain and range assessments.
4. How can I visualize functions to find domain and range effectively?
Utilizing a graphing calculator or software aids significantly in visualizing functions efficiently. Plot specific points and observe behaviors at critical points and asymptotes to gain better insights into the function’s domain and range.
5. What is the significance of understanding limits regarding domain and range?
Limits help discern the behavior of a function as it approaches critical boundary points. By understanding these limits, you can better define where the function is continuous or consider whether the function reaches certain y-values at its endpoints.
“`