How to Effectively Find the Slope of a Graph
Understanding the slope of a graph is critical for anyone working with linear equations and graphical representations. In this comprehensive guide for 2025, we will explore various aspects of finding the slope. From the basic definitions to practical applications in real life, this article aims to equip you with the knowledge and tools to calculate slope effectively.
Understanding the Slope Definition
The slope definition is fundamental to grasping its importance in graphical analysis. In simple terms, the slope represents the steepness or incline of a line on a graph. Mathematically, it is often described using the “Δy over Δx” relationship, referred to as “rise over run.” The rise indicates the vertical change between two points, while the run represents the horizontal change. A positive slope indicates an upward trajectory, whereas a negative slope indicates a downward trend. The concept of zero slope is applicable when there is no change in the y-values despite an increase in x-values, indicative of a horizontal line, while an undefined slope occurs when there is a vertical change with no horizontal change, representative of a vertical line.
Rise Over Run Explained
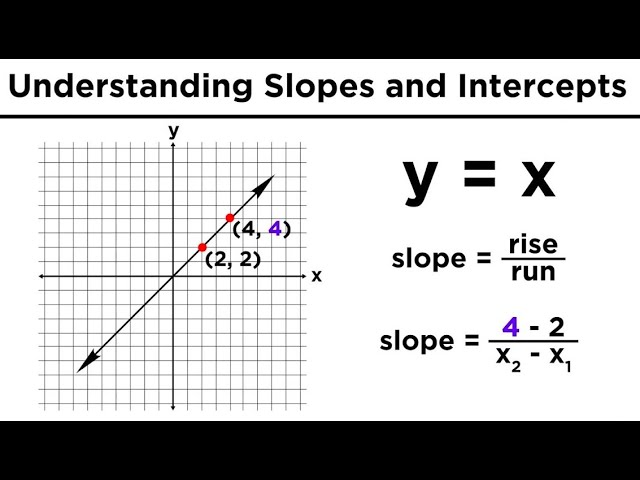
The term “rise over run” is crucial in understanding how to find slope accurately. This expression helps in visualizing the changes in the y-axis concerning the changes in the x-axis. For instance, if you have two points on a graph, (1, 2) and (4, 6), the rise would be “6 – 2 = 4”, while the run would be “4 – 1 = 3”. Therefore, the calculation for slope would be 4/3. This straightforward method not only helps in analytical contexts but is also valuable for real-world applications where you might need to analyze trends or rates.
Identifying Positive and Negative Slopes
Identifying whether a slope is positive or negative is essential in graphical interpretation. A positive slope suggests a direct correlation where as one value increases, the other does too, often seen in growth metrics like economics and population dynamics. In contrast, a negative slope signifies an inverse relationship, with value decreases represented by a downturn on graphs, crucial in fields such as physics or economics. Understanding these slopes is vital to help readers and viewers interpret data correctly. Examples in the workplace can range from analyzing sales patterns in relation to pricing strategies to understanding and analyzing trends demonstrated in scientific experiments.
Slope Formulas and Calculation Methods
Several methods exist for calculating slope, each beneficial depending on the context of the data and the format of information available. One prevalent method is using the slope formula typically defined as \( m = \frac{y_2 – y_1}{x_2 – x_1} \). We can apply this to scenarios where precise coordinates of points on a graph are given. In practice, finding the slope becomes a matter of substituting values into this formula. For example, using our prior example with points (1, 2) and (4, 6), you apply the \( m \) definition: \( m = \frac{6 – 2}{4 – 1} = \frac{4}{3} \).
Graphical Representation of Slope
Visualizing slope is fundamental to understanding its application. When graphing linear equations, it is possible to immediately determine slope from a graph by simply observing the incline of the line. By plotting the linear equation \( y = mx + b \), where \( m \) is the slope, you can illustrate how steep a line is. Furthermore, when teaching slope, consider using graphs alongside dynamic software tools that allow live changes in slope representation. This interactive experience solidifies comprehension of various slope calculations across different contexts, enhancing learning outcomes.
Calculating Slope Between Two Points
Finding the slope between two points consists of key steps that enable precision and clarity in calculations. Start by identifying the coordinates of your points, which can be provided or visualized through graphical data. Once you have the points, use the slope formula by substituting in the y-values and x-values. For individuals working with large data sets or even programming contexts, automating the slope calculation can enhance accuracy and efficiency. Whether dealing with coordinates on a coordinate plane or clustering points in data management, the principles of calculating slope remain constant, reinforcing its role in mathematical frameworks.
Slope Applications in Real Life
The relevance of slope extends beyond mathematics; it permeates various fields ranging from engineering to physics, economics to biology. Understanding slope applications can facilitate decision-making processes across industries and improve analytical tools. Whether determining budgets, calculating angles for construction, or analyzing trends in environmental data, mastering slope calculation proves invaluable. Understanding how to represent slope graphically allows for better interpretation of data trends.
Slope in Physics and Engineering
In physics and engineering, the concept of slope is crucial when working with vectors and analyzing forces. The slope tells architects how inclined a roof should be for optimal drainage, and guides engineers when designing ramp structures, ensuring they meet safety and functionality standards. Additionally, the calculation of gradients in roads and inclines can influence transport logistics and designs. Understanding slope here means recognizing its impact on practical outcomes.
Slope in Economics and Data Analysis
From a business standpoint, slope assists in analyzing the relationship between variables such as price elasticity and revenue. Techniques such as regression analysis harness the power of slope to inform decisions and predict trends, invaluable in a landscape shaped by data-driven decision-making. By understanding slope and correlation, economists can identify whether policies or changes have the intended financial effects within the marketplace.
Key Takeaways
- The slope formula provides a straightforward approach to calculating slope between points.
- Rise over run is integral to slope interpretation, reflecting changes in two-dimensional graph space.
- Visual representation of slope allows for practical analysis in real-life applications across various fields like physics and economics.
- Mastering slope concepts empowers learners to confidently approach advanced topics in calculus and statistics.
FAQ
1. What is the significance of slope in statistics?
The significance of slope in statistics often ties directly to the correlation between variables. A strong positive slope indicates that when one variable rises, so does the other, showcasing a positive relationship. Conversely, a strong negative slope points to an inverse relationship whereby one value decreases as the other rises. Understanding slope provides insight into data trends and predictions in statistical analysis.
2. How do I determine slope from a graph visually?
To determine slope visually from a graph, identify two distinct points along with the line, preferably where it crosses grid lines for easier measurement. Measure the difference in y-values (rise) and the difference in x-values (run) between these points. The slope is calculated by dividing the rise by the run, allowing for a visual estimation of the line’s steepness.
3. Can slope be zero or undefined?
Yes, slope can indeed be zero or undefined. A zero slope occurs in horizontal lines, indicating constant y-values regardless of x-value changes. An undefined slope characterizes vertical lines, where no alteration occurs in x-values with y-value changes. Recognizing these types is essential for graph interpretation in mathematics.
4. What are some common challenges with slope comprehension?
One common challenge in slope comprehension involves misunderstanding its graphical representation. Miscalculating rise and run or failing to account for units can often lead to misconceptions. Additionally, interpreting slope from more complex datasets, where multiple variables affect outcomes, complicates matters further. Despite these challenges, practice and proper resources can greatly enhance understanding.
5. How is slope related to linear equations?
Slope serves as a critical component of linear equations, commonly represented in the form \( y = mx + b \) where \( m \) is the slope, making it clear how changes in x will impact y. This relationship is foundational in algebra, facilitating deeper analyses in mathematics and beyond. Through understanding slope definitions in relation to linear equations, learners can apply this knowledge to various problem-solving scenarios.